When the System Gets It Wrong
A payroll data analysis revealing nine months of underpayment across a small retail chain
A Problem Hidden in Plain Sight
Small business wage underpayment rarely looks like theft. Most of the time, it looks exactly like what it is: a payroll system configured incorrectly when the business opened, compounding quietly with every pay cycle.
This project simulates the kind of analysis performed when employer records are examined against award requirements under a compliance review. Using a synthetic dataset modelled on real Central Coast NSW retail businesses and actual award provisions from the General Retail Industry Award 2020, I structured the analysis around the compliance principles outlined in Fair Work Ombudsman published guidance on small employer underpayment patterns, tracing a systematic underpayment from its source in a payroll misconfiguration to the total amount owed across nine months of trading.
The answer, when it came, was $33,753.11, owed to 20 workers who had no idea they were being underpaid.
Chapter 1: What the Employer Handed Over
Three files. The starting point for this payroll compliance review.
Three files. That's the starting point I designed this project around: the three record types a small retail employer would typically produce in response to a compliance request under s.712 of the Fair Work Act 2009.
A staff masterfile listing every employee, their classification level, employment type, and the hourly rate recorded in the payroll system. A time and attendance export showing every shift worked, with clock-in, clock-out, and hours recorded but no rates attached. And a fortnightly payroll export showing what each employee was paid each fortnight as a lump sum, with no shift-level breakdown.
The employer in this case is Coastal Convenience Pty Ltd, a fictional three-store retail chain operating from Gosford Imperial Centre, Erina Fair, and Westfield Tuggerah on the Central Coast of NSW. Fifty employees. Three store managers. A mix of full-time, part-time, and casual staff across classification Levels 1 to 4 under the General Retail Industry Award 2020 [MA000004].
The first analytical step I built into this pipeline was a base rate audit, comparing every employee's recorded hourly rate against the award minimum for their employment type and classification level before examining a single shift record. The award rates are independently sourced from the FWO Pay Guide, not derived from the employer's own records. This separation between what the employer claims and what the award requires is the structural principle the entire analysis rests on.
Chapter 2: What the Shifts Revealed
5,632 shifts. 6,187 payable segments. One structural principle.
Building the analytical picture required constructing something not present in the employer records.
A segment-level breakdown of every shift, with each segment assigned its correct award rate independently of what the employer paid. I built this as a separate data preparation step, keeping it out of the generated employer records since segment-level entitlement reconstruction is analytical work rather than something an employer produces.
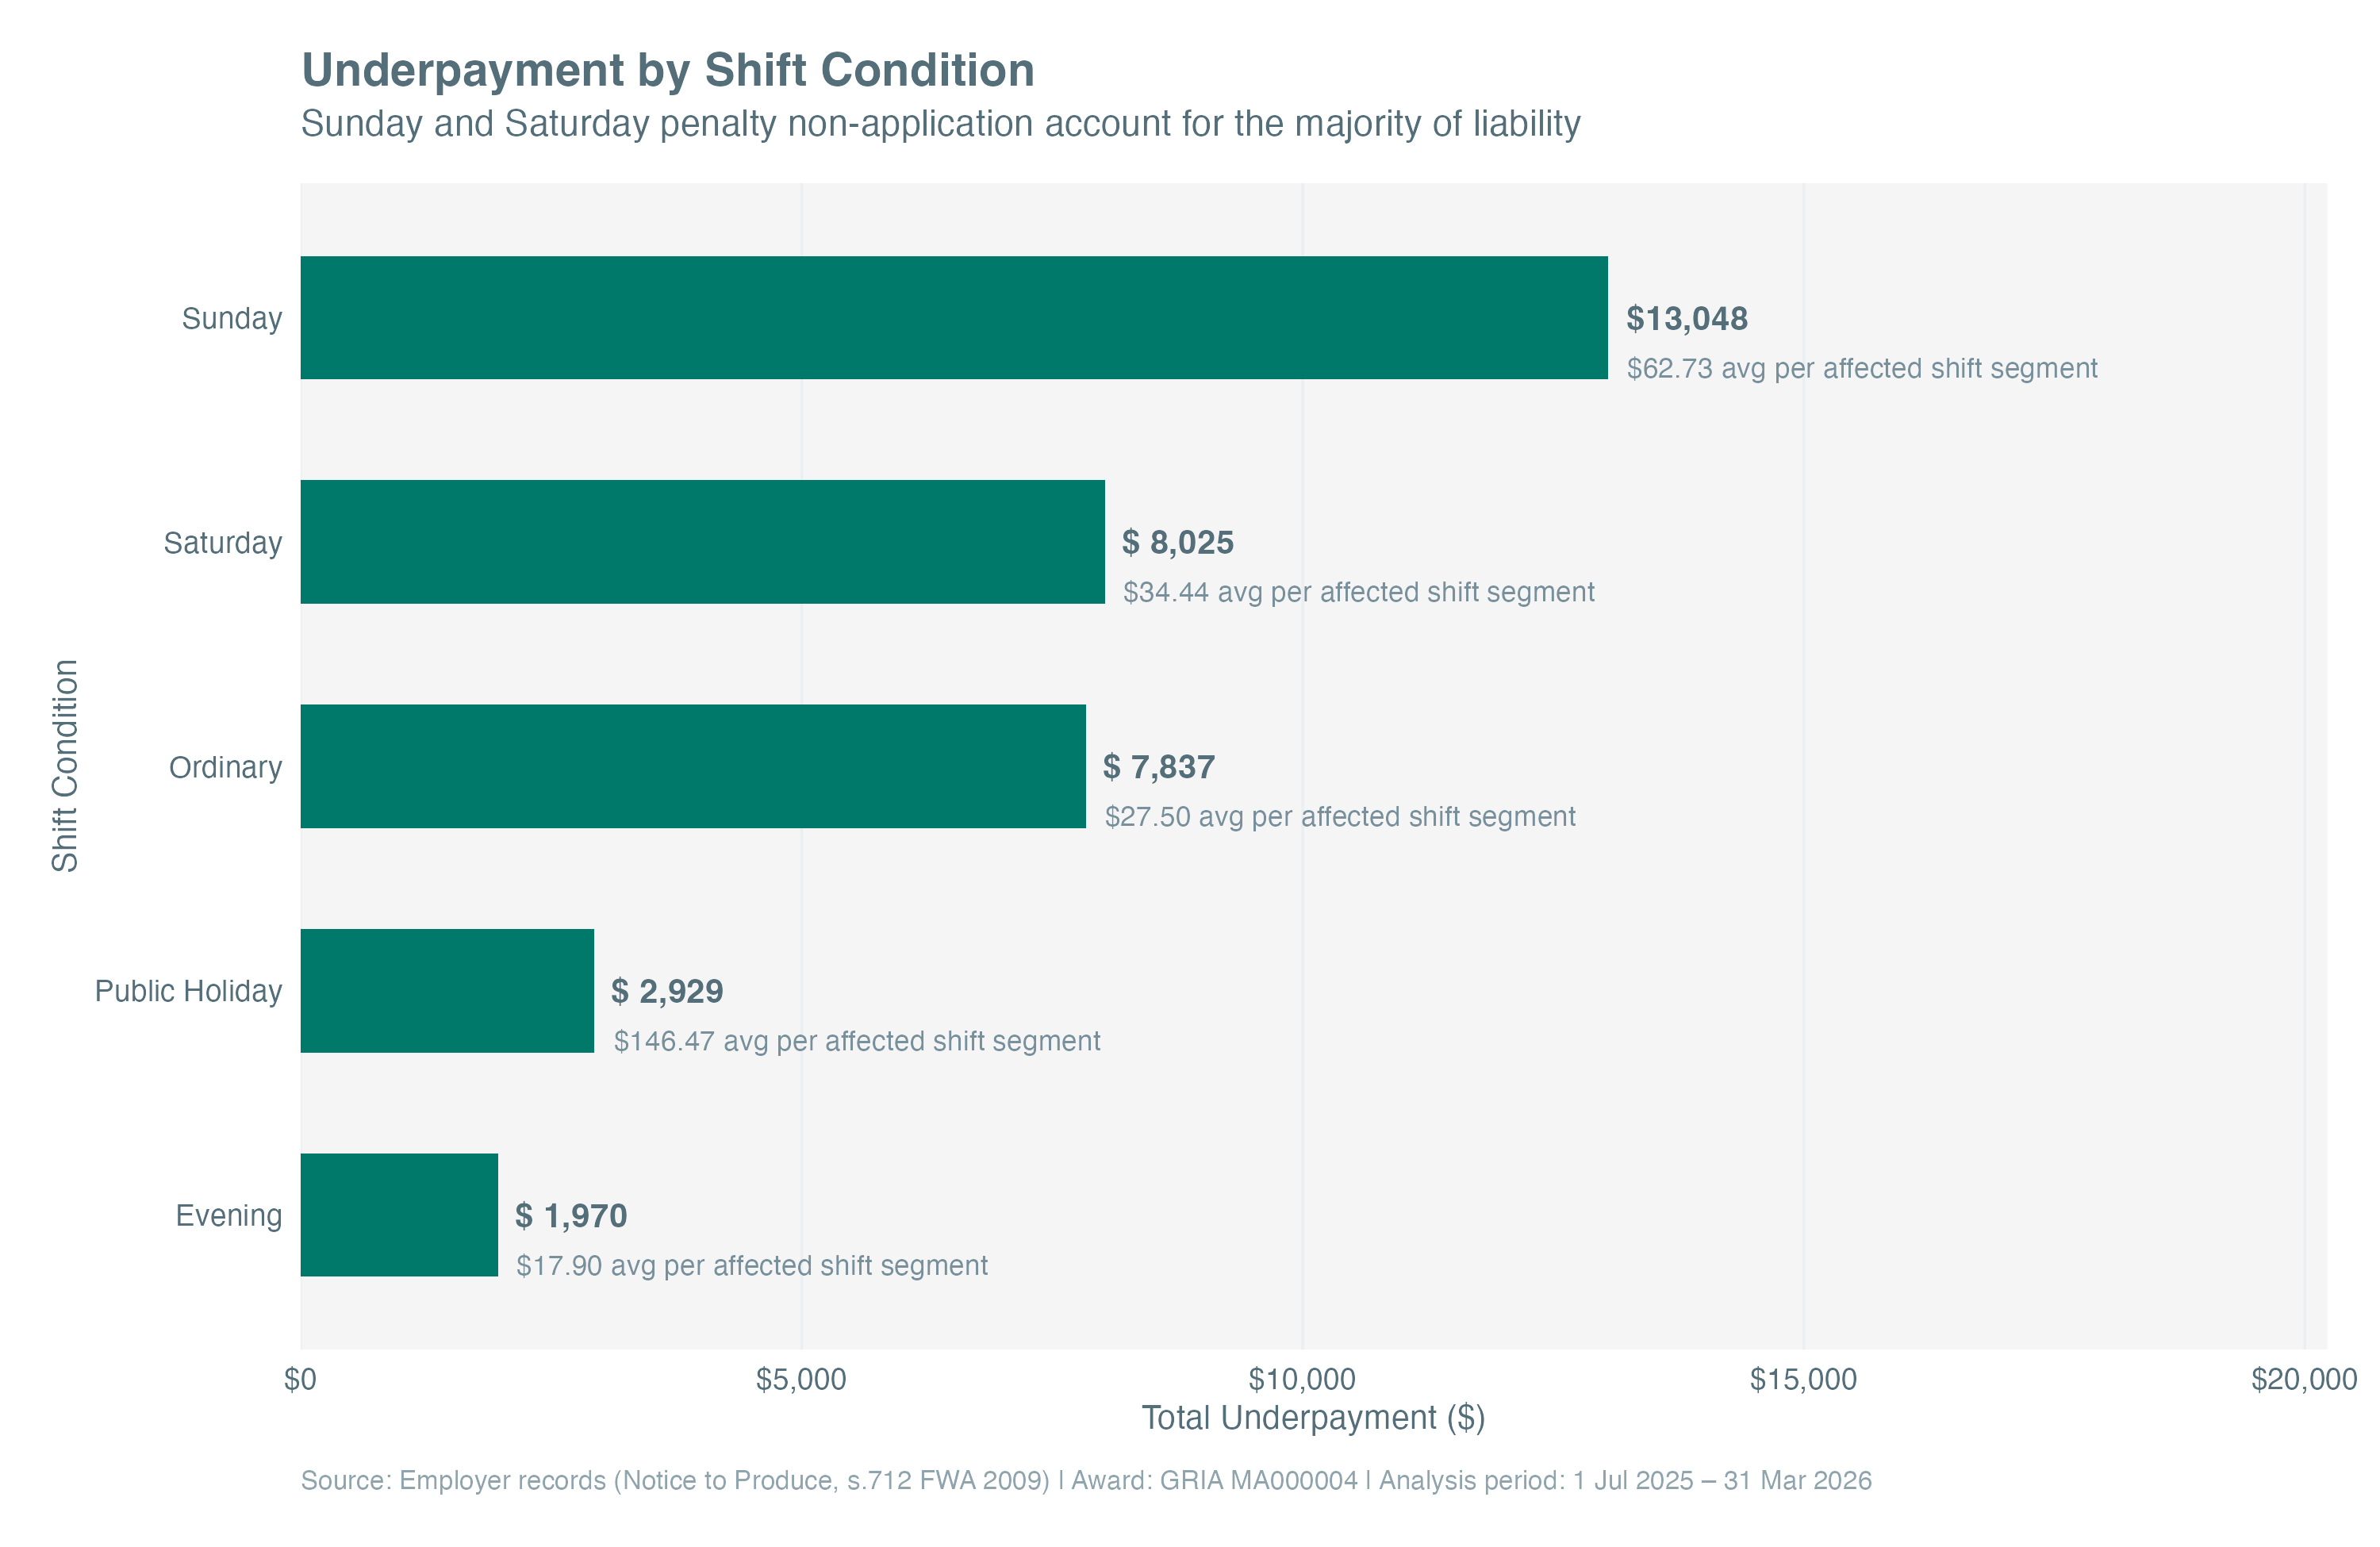
The General Retail Industry Award specifies different rates for different shift conditions. Ordinary weekday hours attract one rate. Hours worked after 18:00 on a weekday attract an evening loading. Saturday, Sunday, and public holidays each have their own rates, applied to the entire shift. A weekday shift that crosses 18:00 must be split at that boundary, with the hours before attracting the ordinary rate and the hours after attracting the evening rate.
5,632 shifts became 6,187 payable segments. The 555 additional segments represent Thursday evening shifts at Erina Fair and Westfield Tuggerah, where both stores trade until 21:00, creating evening penalty exposure every week for employees rostered on that day.
Underpayment by Shift Condition
Chapter 3: The Statistical Signature
Dollar figures confirm underpayment. Statistics reveal the pattern behind it.
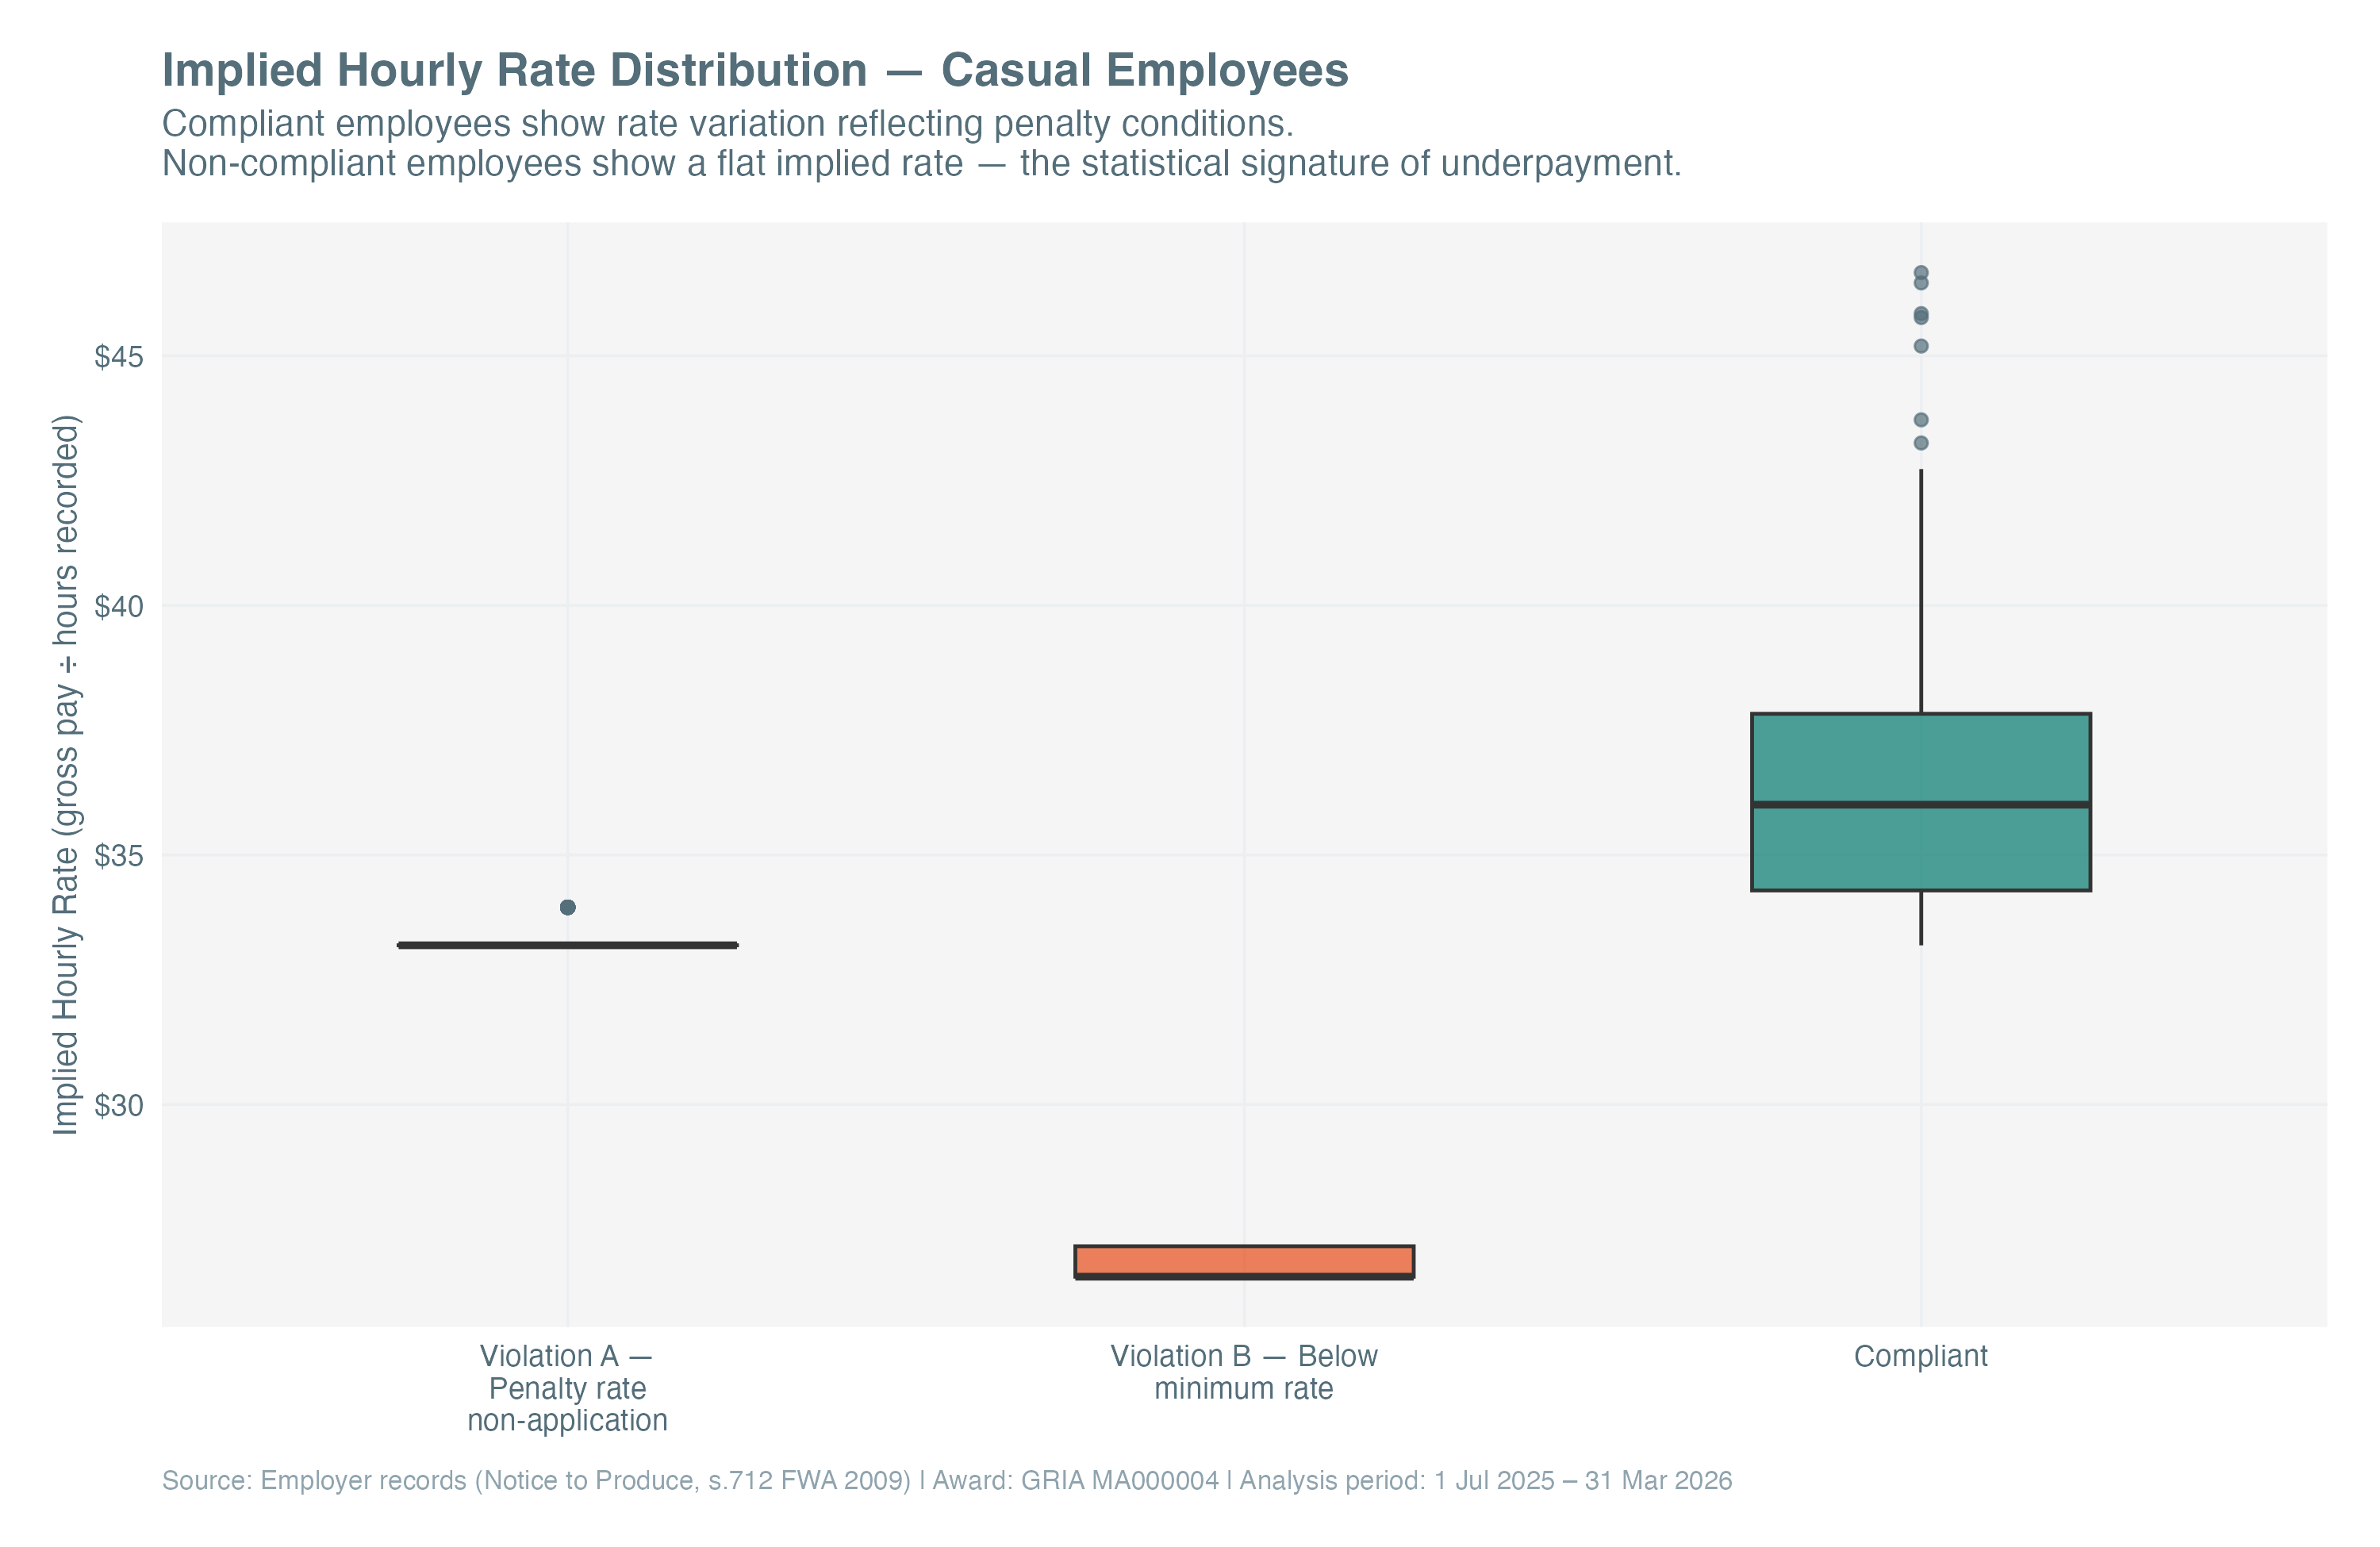
For every employee, the analysis calculated a fortnightly implied hourly rate: gross pay divided by hours recorded. For a correctly paid employee, this figure should vary. A fortnight with more Saturday and Sunday shifts should produce a higher implied rate than a quieter weekday-heavy fortnight, because penalty rates inflate the gross payment relative to hours worked.
For a non-compliant employee, the implied rate will show as flat. If the employer is paying one rate regardless of shift conditions, the ratio of gross pay to hours will be the same every fortnight, regardless of how many weekends, evenings, or public holidays were worked.
The coefficient of variation, the standard deviation of implied rates expressed as a percentage of the mean, quantifies this. A compliant employee shows meaningful variation. A non-compliant employee shows near-zero variation.
Implied Hourly Rate Distribution — Casual Employees
Chapter 4: Two Violations, One Root Cause
Different symptoms. Both traceable to the same payroll setup error.
Violation A
Penalty Rate Non-Application
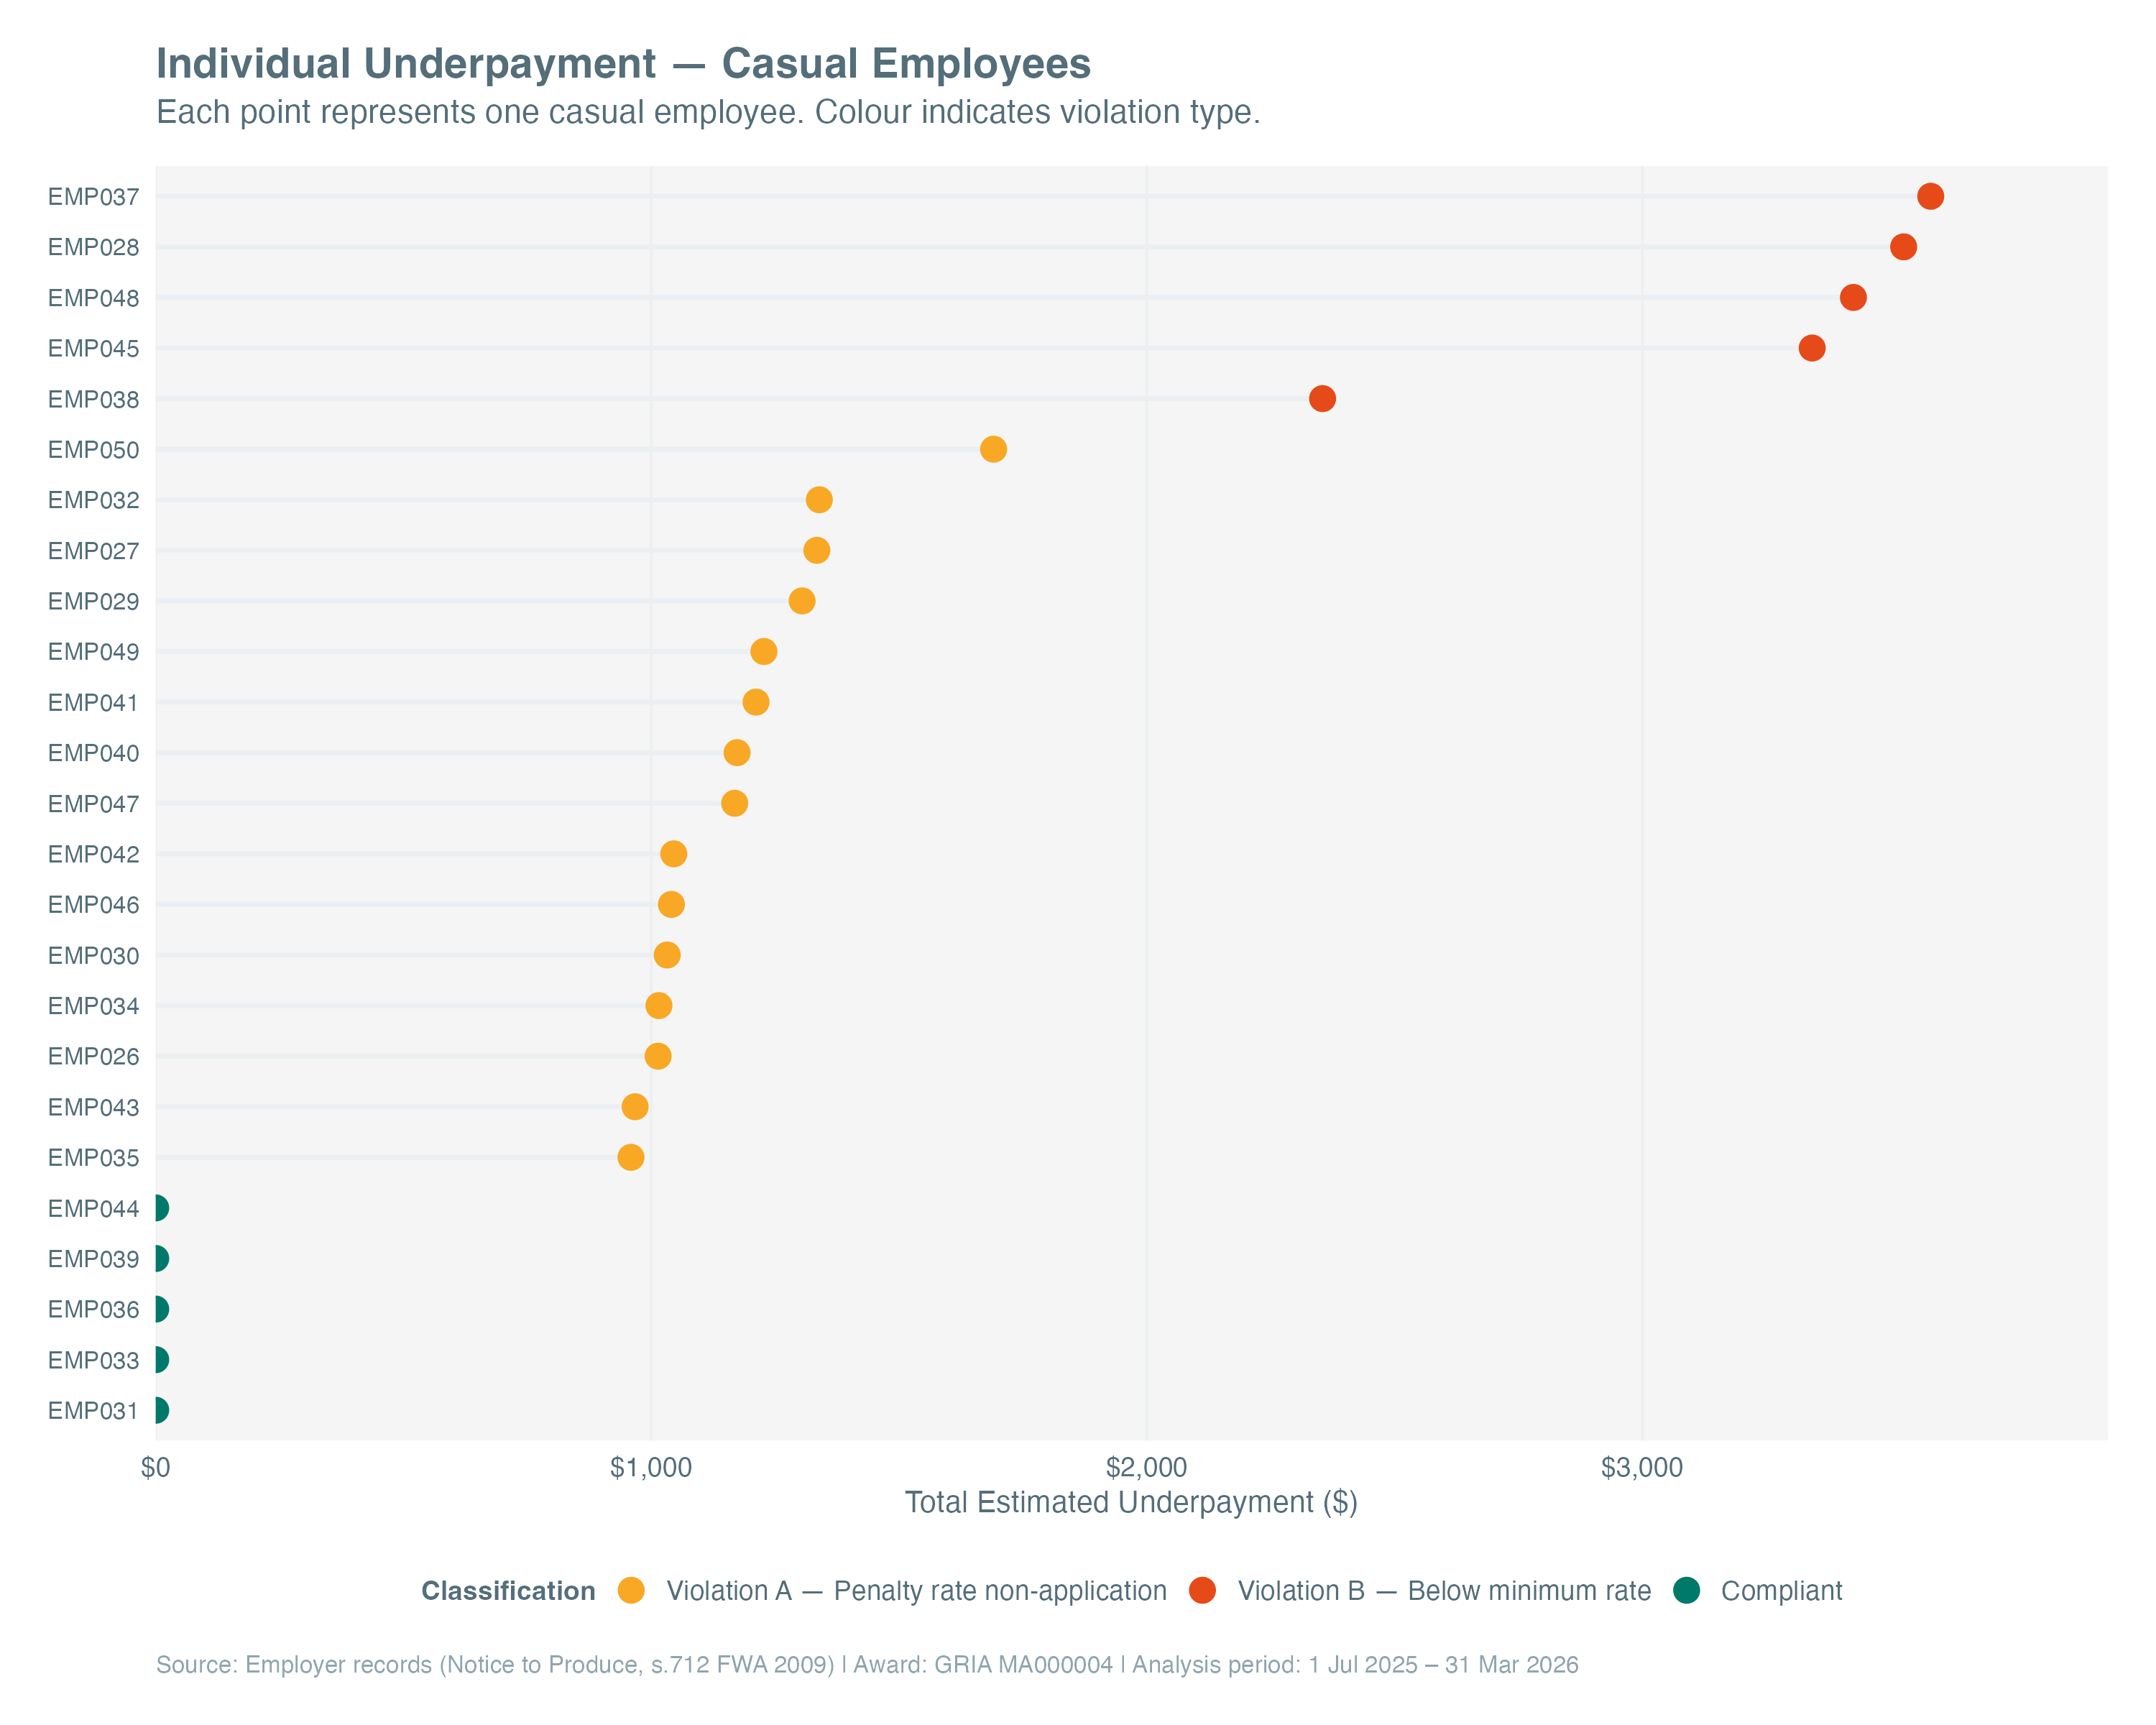
Affected 15 casual employees. Base rates were correct, with the casual ordinary rate including the 25% loading. But the payroll system had no penalty rate rules configured. Every shift, regardless of day or time, was paid at the ordinary rate.
Violation B
Below Minimum Rate
Affected 5 casual employees. Base rates were wrong: the employer had entered the pre-loading FT/PT rate instead of the correct casual ordinary rate, without understanding that the 25% casual loading must be included. These employees were underpaid on every single shift, not just penalty shifts.
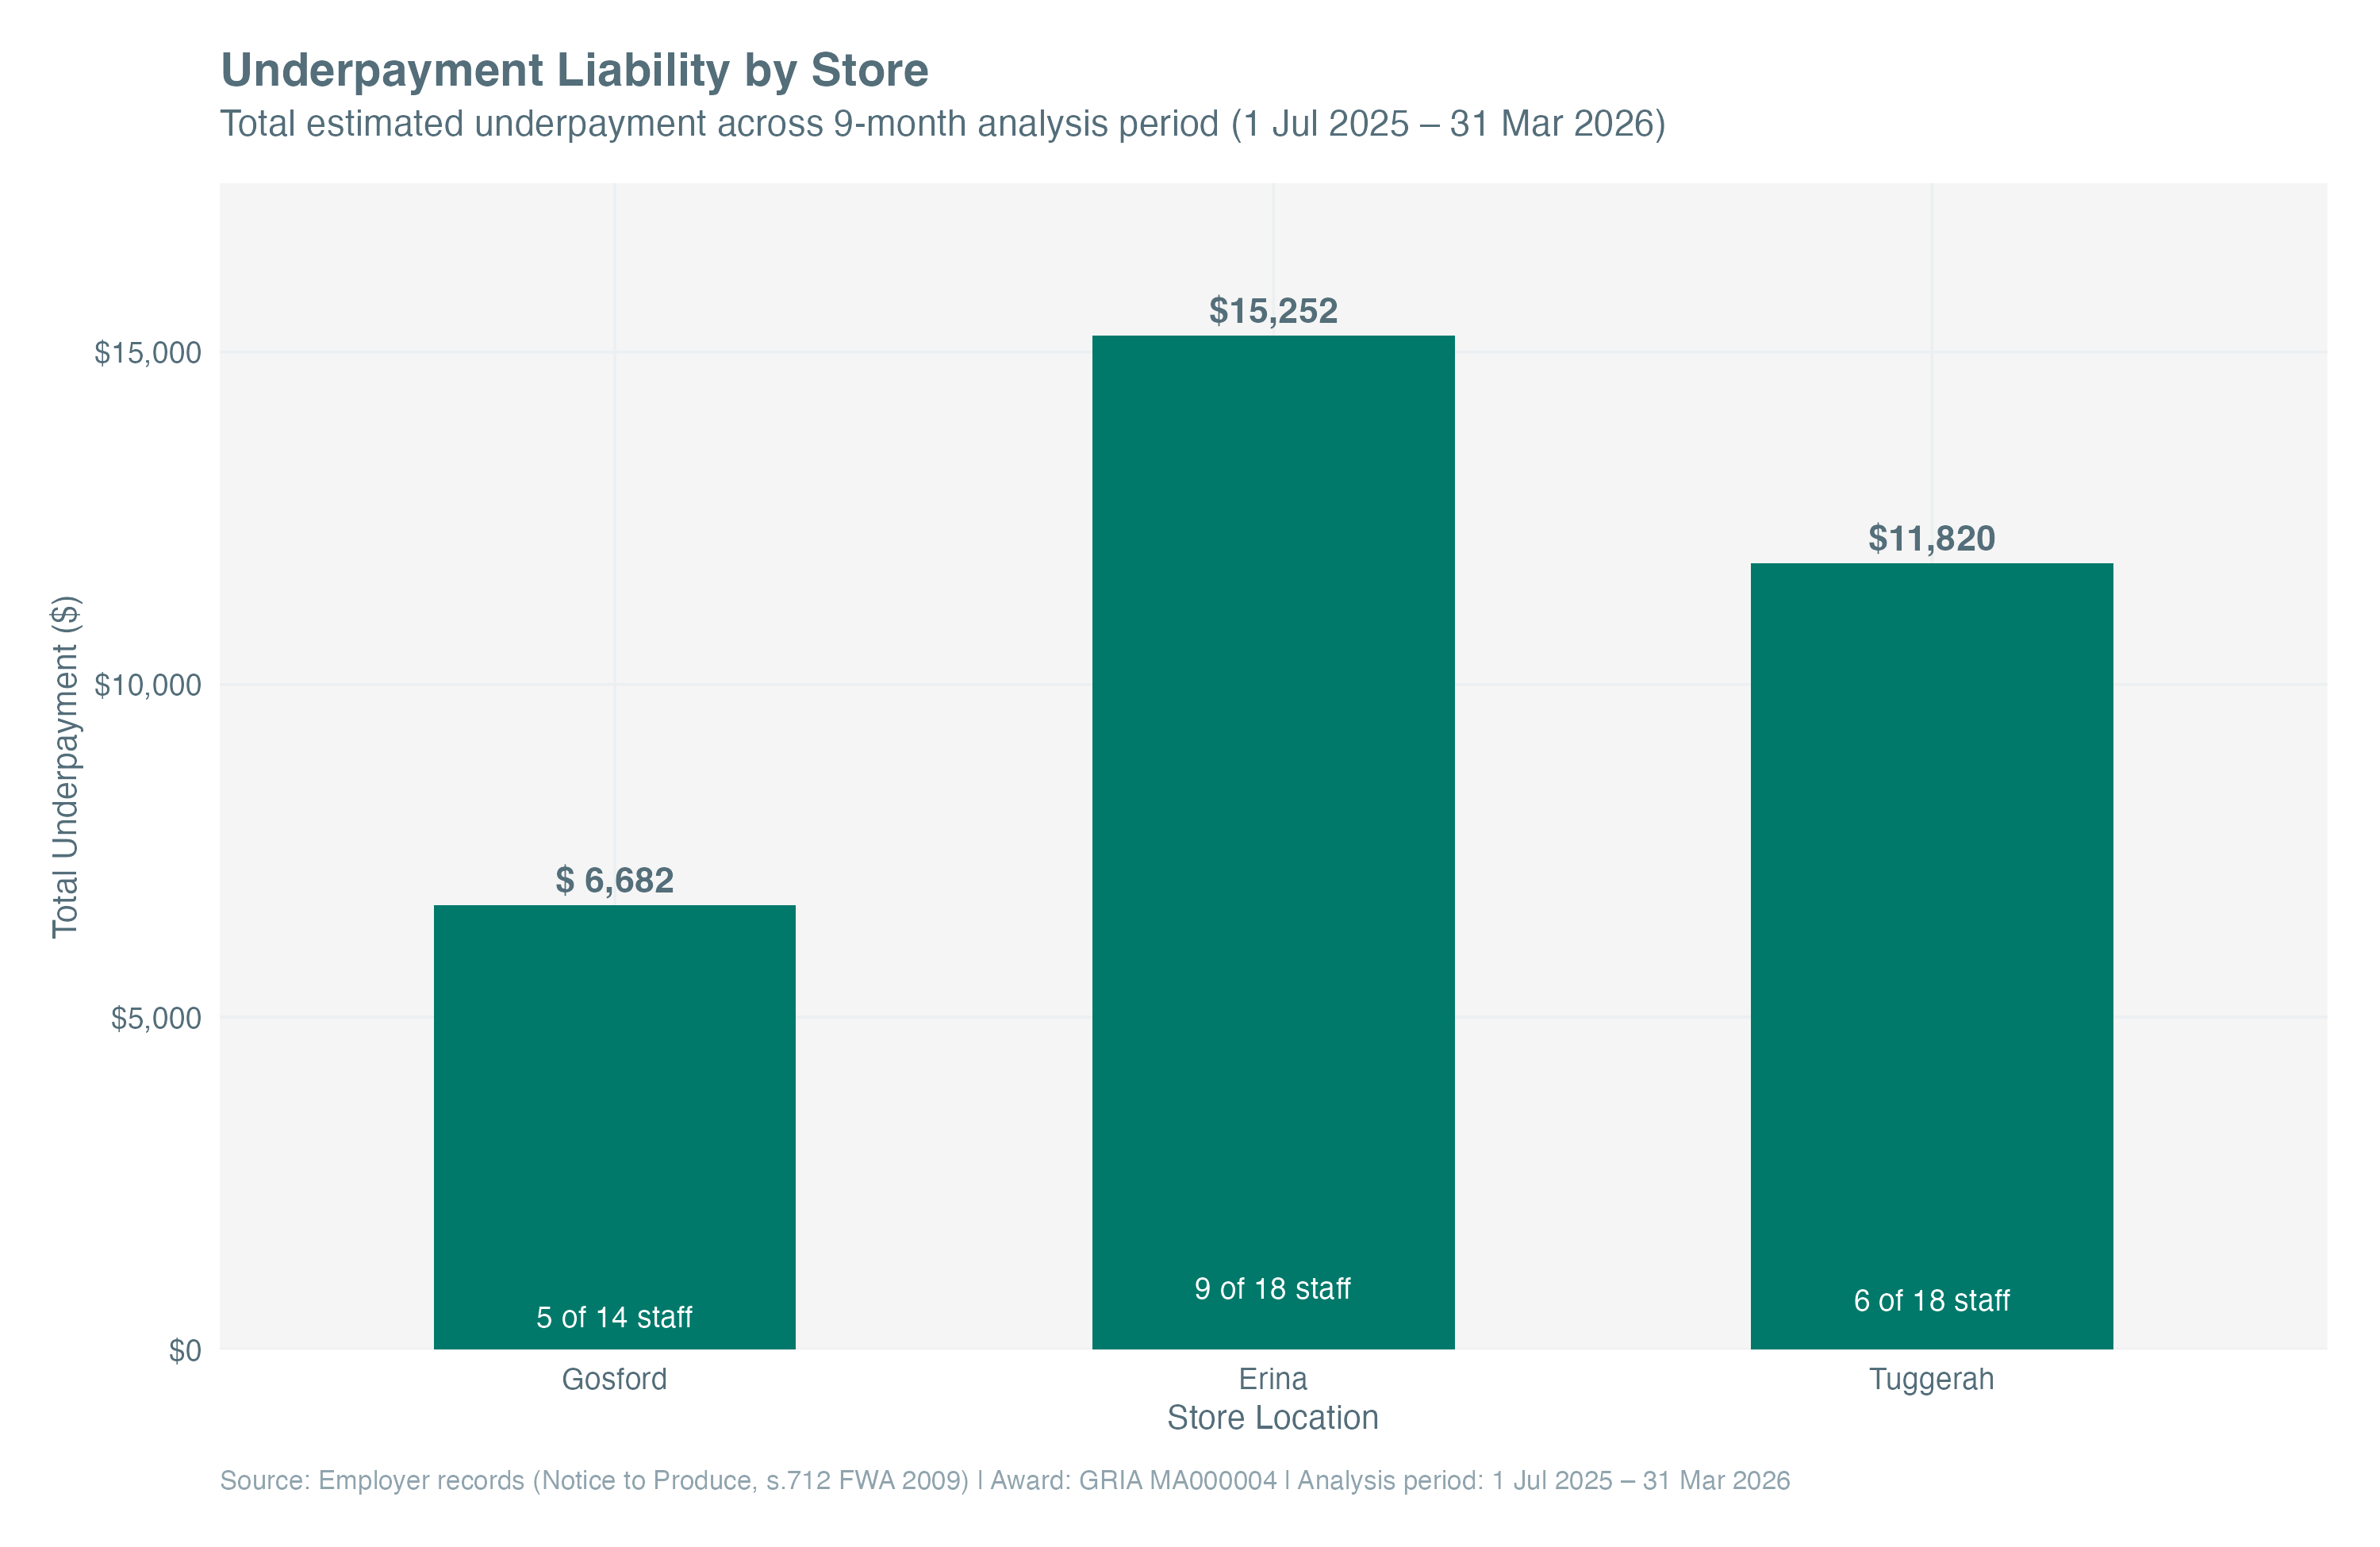
Underpayment Liability by Store
Individual Underpayment — Casual Employees
Underpayment Severity by Casual Employee
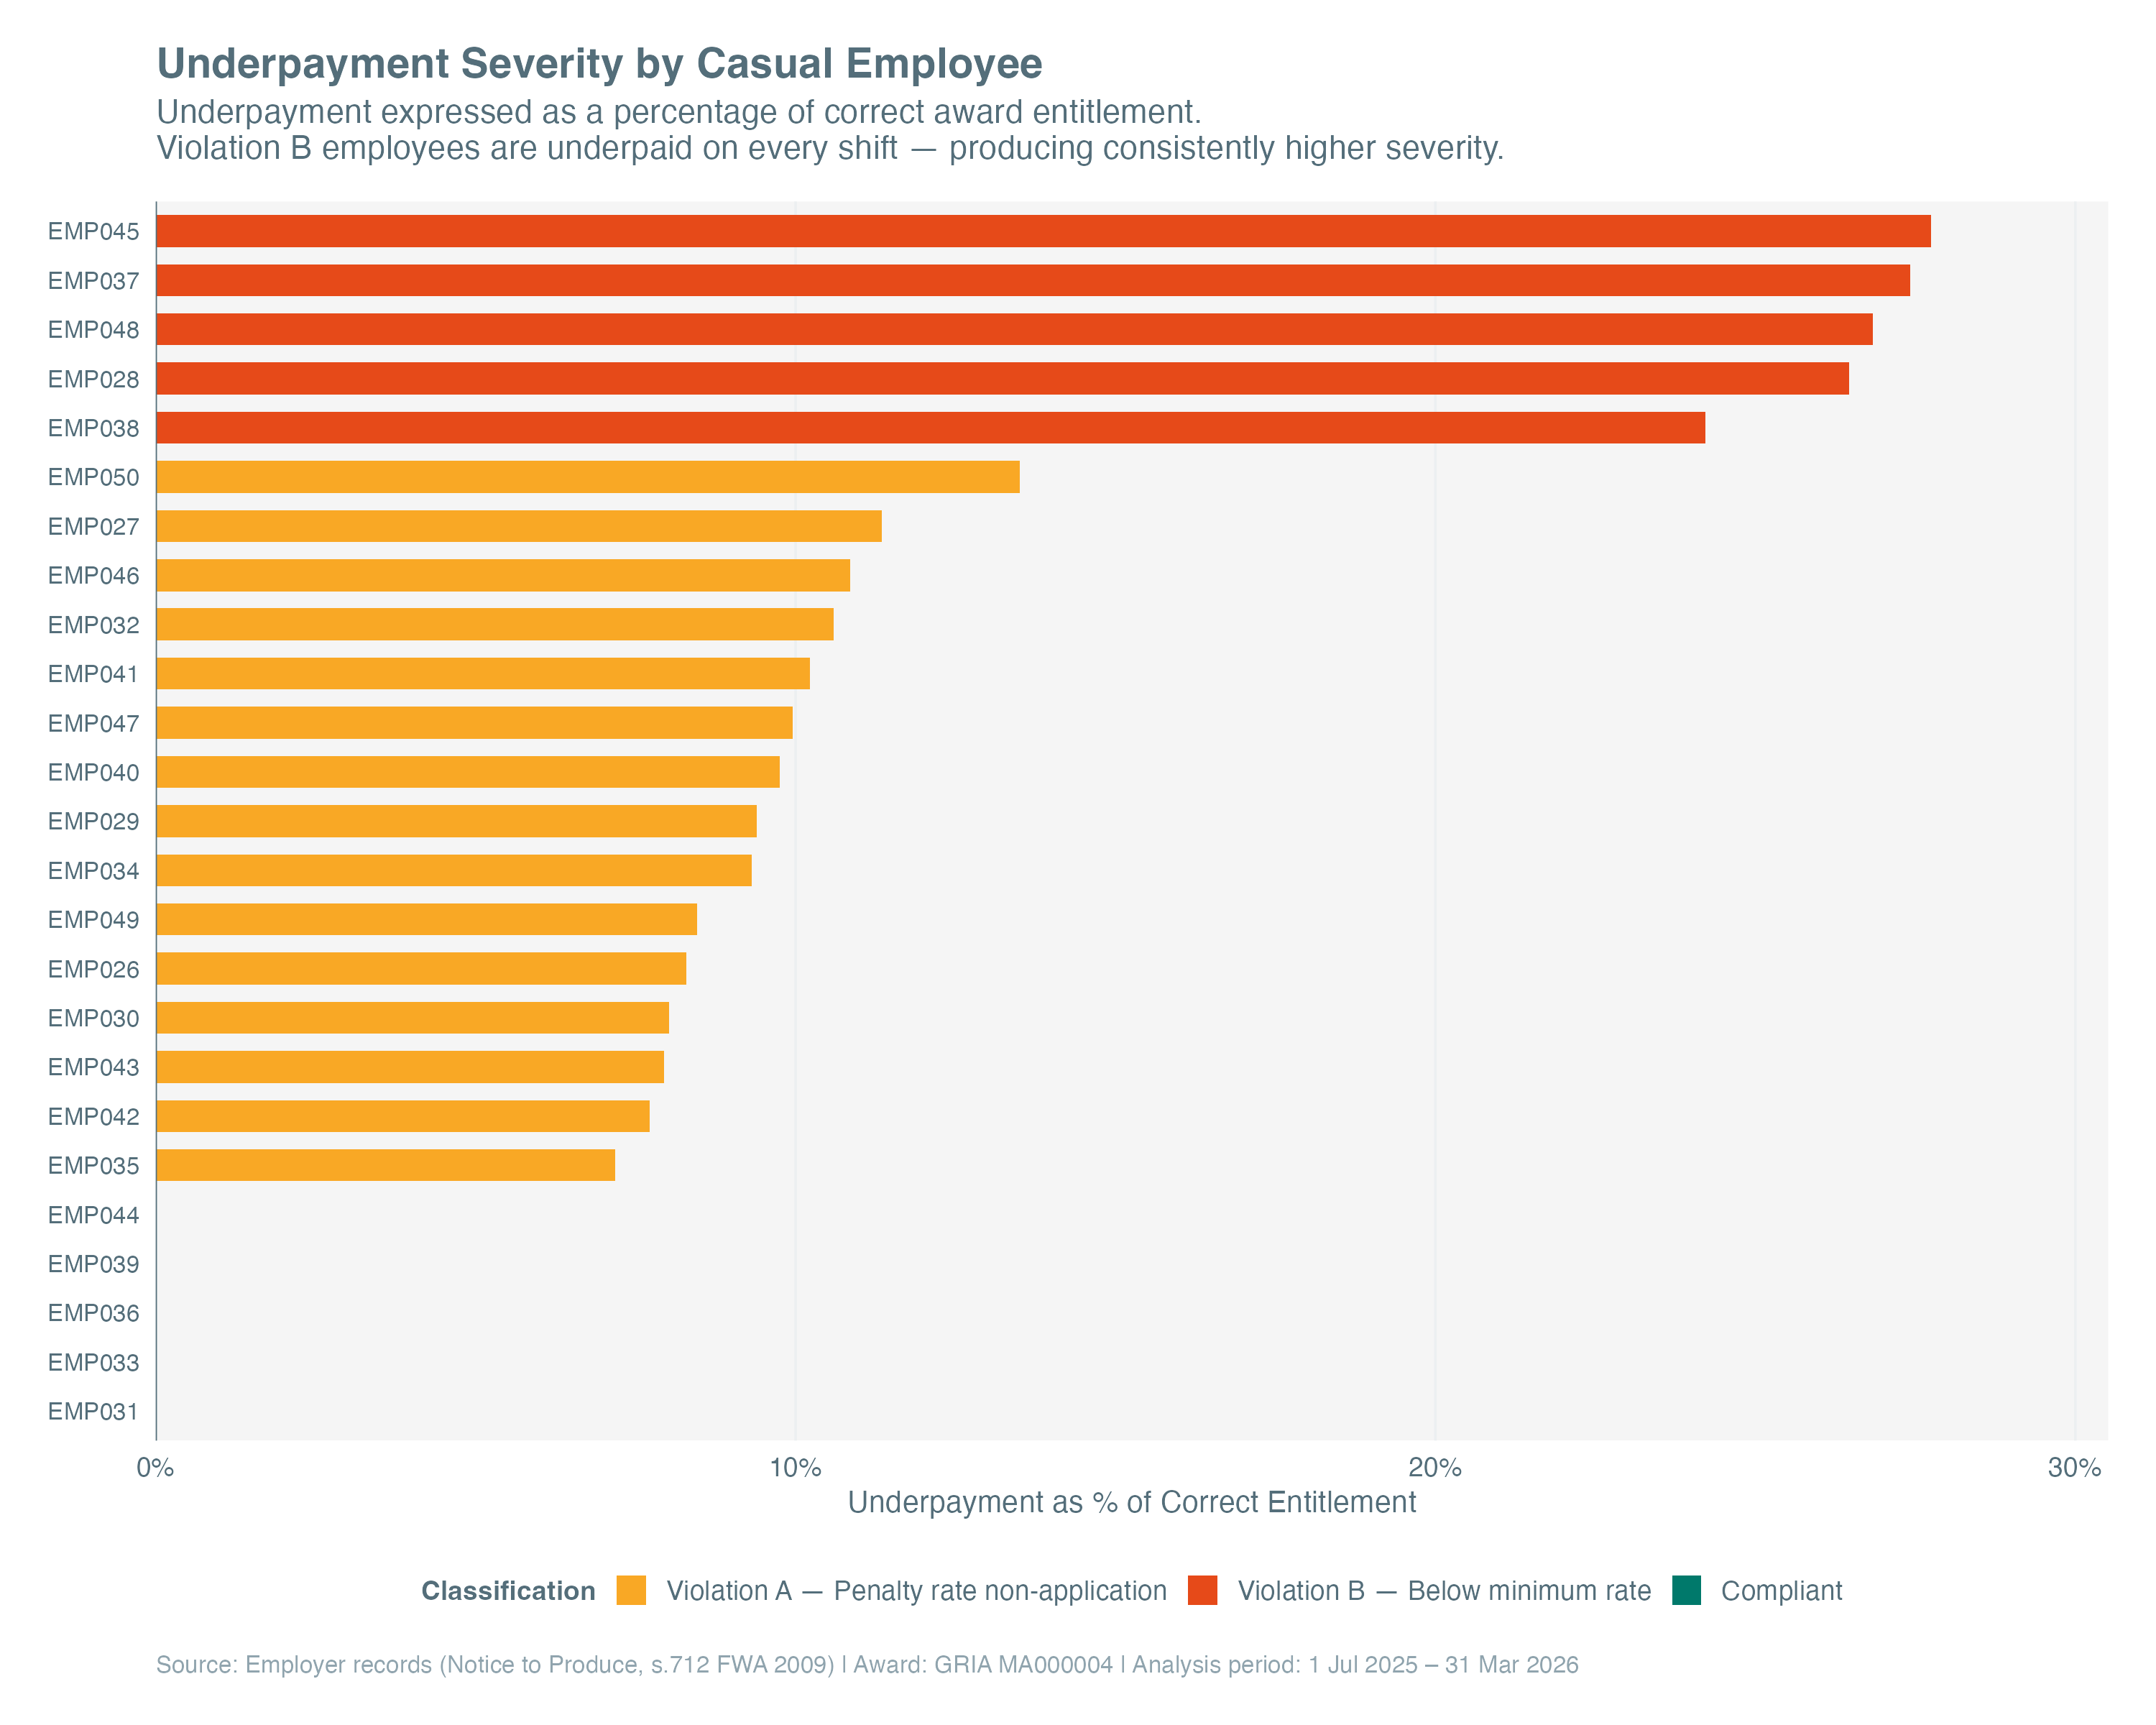
Expressed as a percentage of correct entitlement, Violation B employees were underpaid by 24 to 28 percent of what they were owed. Violation A employees ranged from 8 to 14 percent. In both cases, the workers had no visibility into the error: their payslips showed hours and a dollar amount, with no itemised breakdown of which rate applied to which shift.
Chapter 5: How Liability Accumulated
Both violations were embedded in the payroll system from the start.
Both violations were built into the payroll system from day one, compounding with every shift worked.
Cumulative Underpayment Over Time
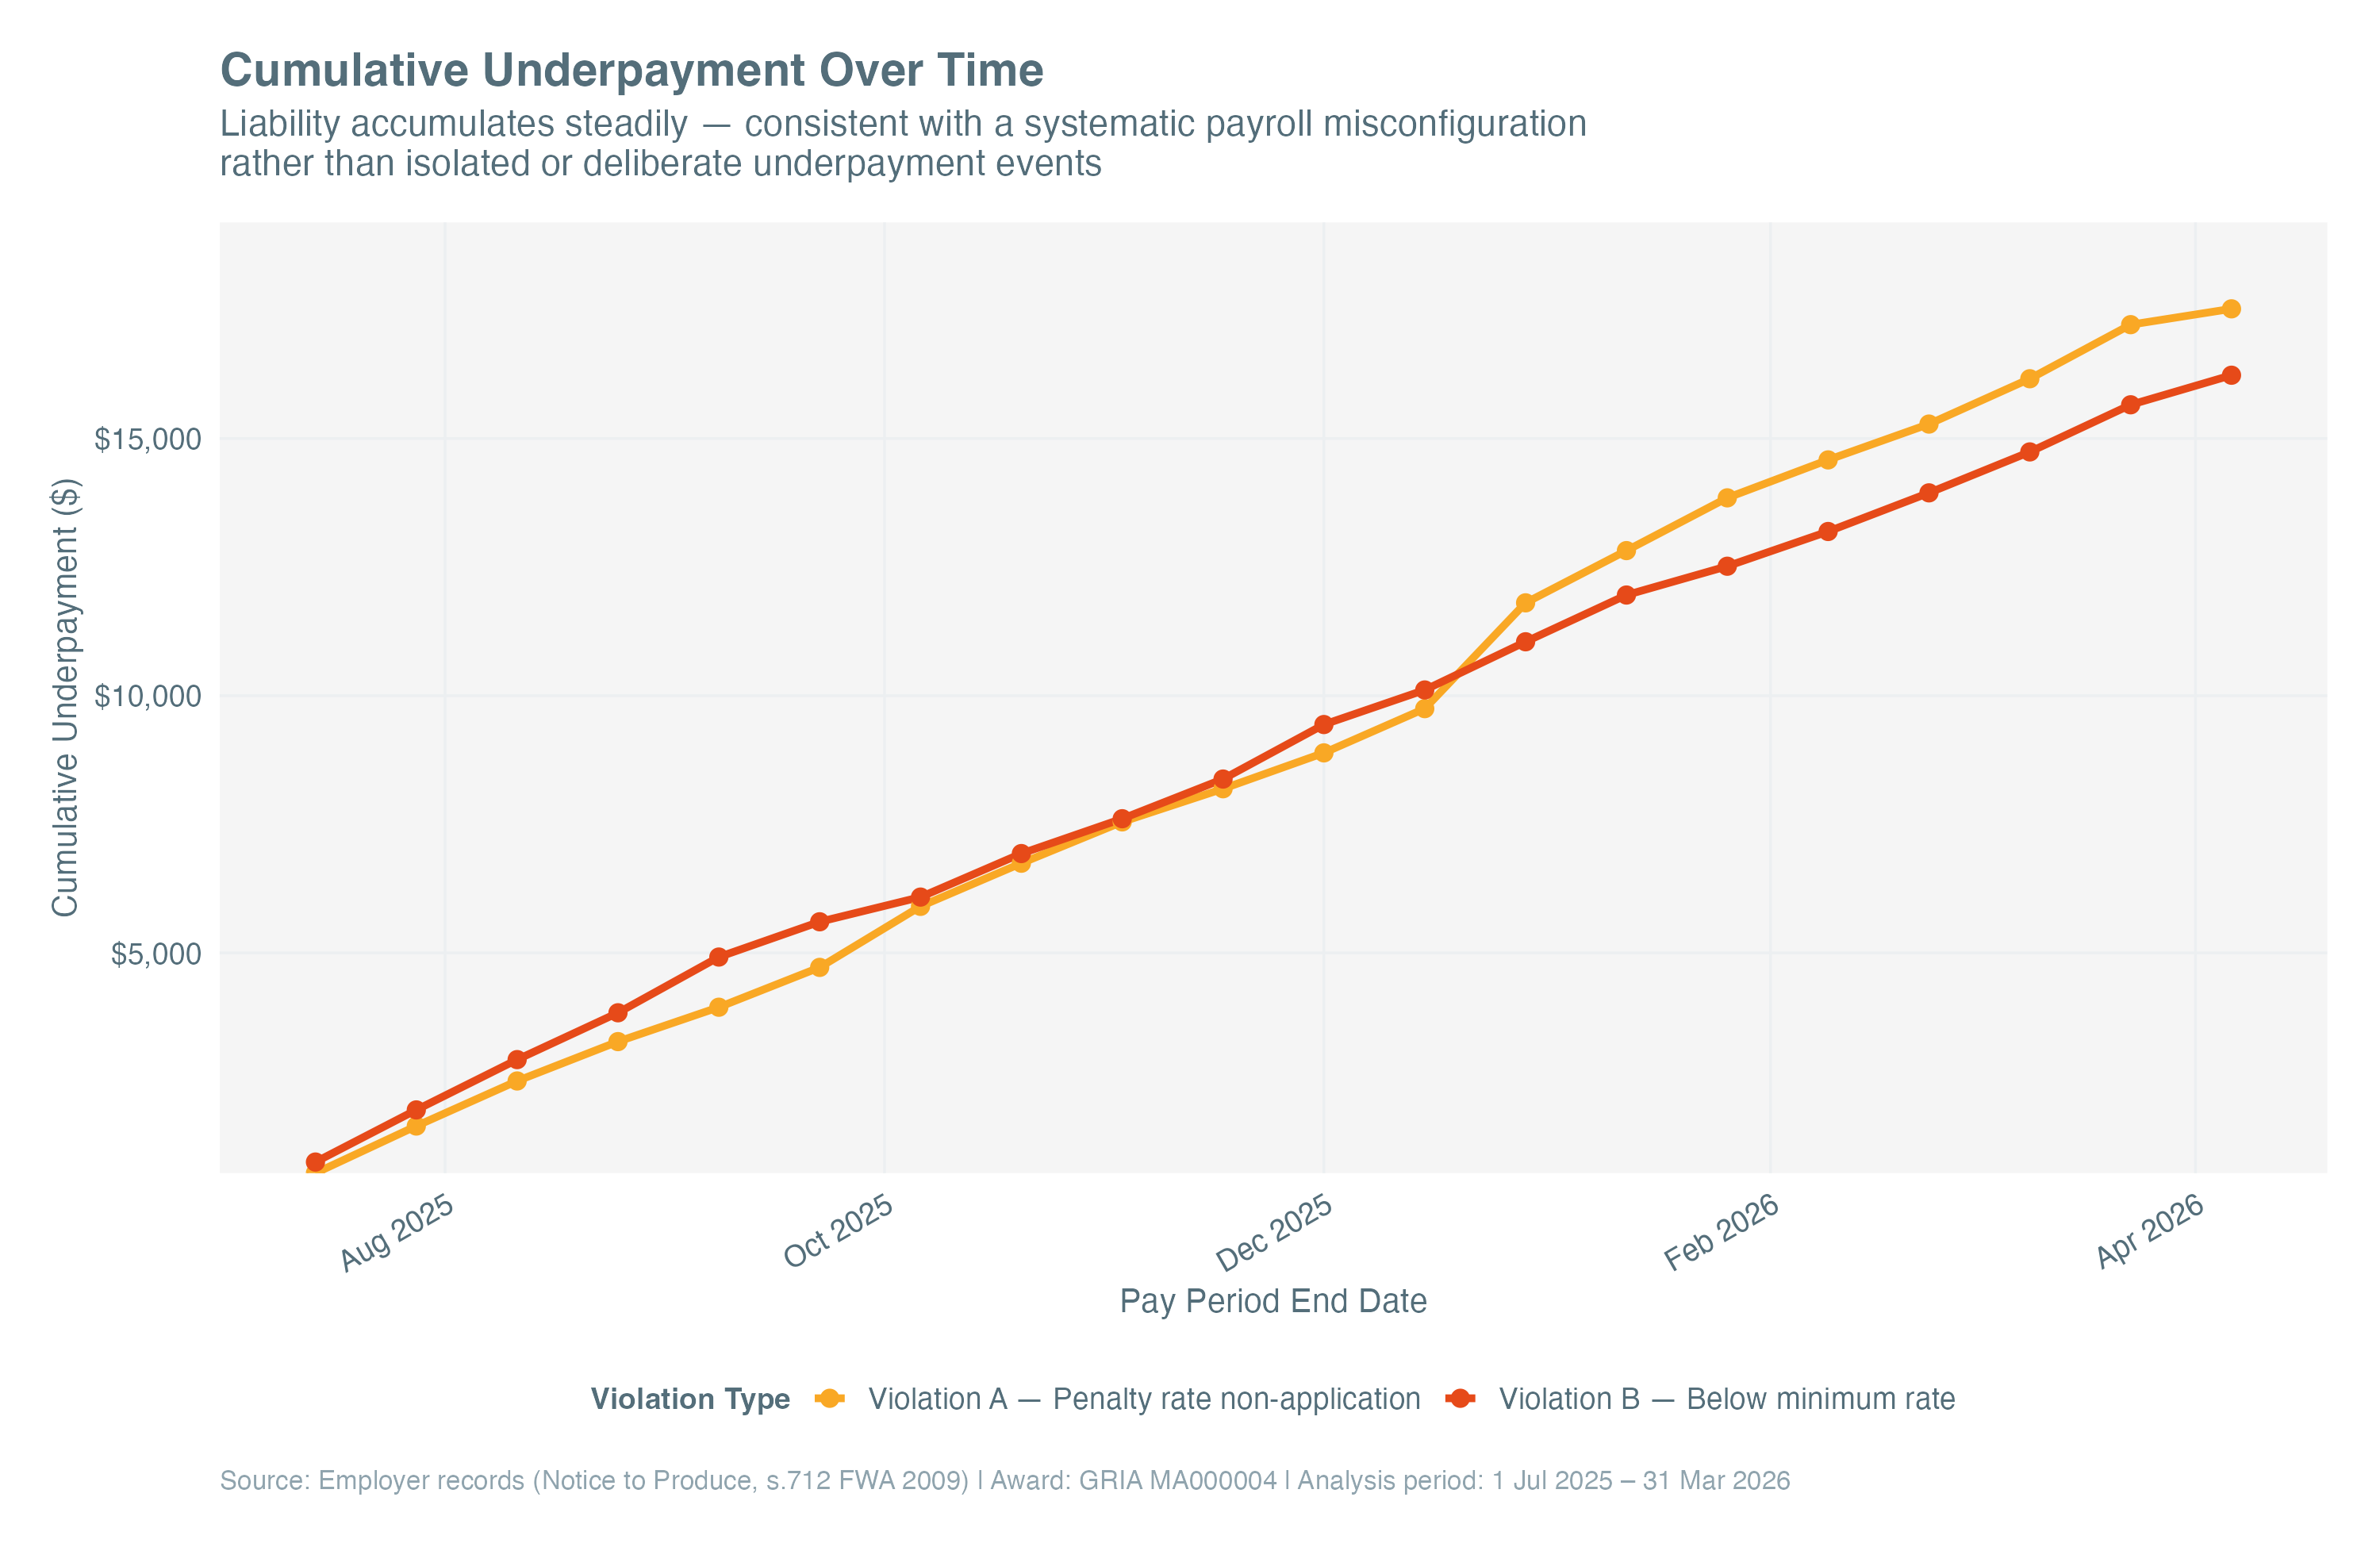
The cumulative chart tells that story clearly. Liability accumulated in a smooth, consistent line across all 20 pay periods. There are no spikes, no anomalies, no periods of correction. In designing this scenario, I wanted to reflect the reality that systematic payroll misconfiguration is often invisible to the employer: the system produces a number, payslips go out, and nothing in the ordinary course of business surfaces the error.
At $33,753 across nine months, the annualised liability is approximately $45,000. For a small retail chain operating on thin margins, a back-payment demand of that magnitude would represent a significant financial event, entirely preventable had the payroll system been configured correctly at setup.
Methodology and Technical Implementation
Transparency in analysis design, data sources, and technical decisions
📊 Data Sources and Design
- • Fully synthetic dataset generated in R
- • Store trading hours sourced from Gosford Imperial Centre, Erina Fair, and Westfield Tuggerah
- • Award rates from FWO Pay Guide, GRIA MA000004, effective 1 July 2025
- • NSW public holidays: gazetted calendar 2025 to 26
- • Violation patterns modelled on FWO published guidance on small employer compliance
🔧 Technical Implementation
- • R with tidyverse and lubridate throughout
- • Four-script pipeline: dataset builder, data preparation, compliance analysis, visualisation
- • Relational dataset design with six tables and primary key joins
- • Segment-level entitlement reconstruction using award_rate_id as the join key
- • Coefficient of variation as the primary statistical detection metric
- • ggplot2 visualisations with custom theme
📐 Script Architecture
- • 01_build_dataset.R generates synthetic employer records into data/raw/
- • 02_data_preparation.R validates, enriches, and builds segments into data/prepared/
- • 03_compliance_analysis.R handles reconciliation and liability quantification into data/analysis/
- • 04_visualisation.R produces portfolio charts into output/charts/
📋 A Note on Methodology
The analytical separation between employer records and award entitlements is a deliberate design decision. Entitlements are reconstructed from the award independently and are never derived from what the employer paid. This approach is consistent with the compliance principles described in FWO published guidance, and it produces a finding that stands on its own logic: the gap between what the award requires and what the payroll recorded, calculated without assumptions about the employer's intent.
Interested in the analysis?
This project demonstrates end-to-end data analysis in R, from synthetic data generation through to compliance findings and visualisation. The complete code is available on GitHub.